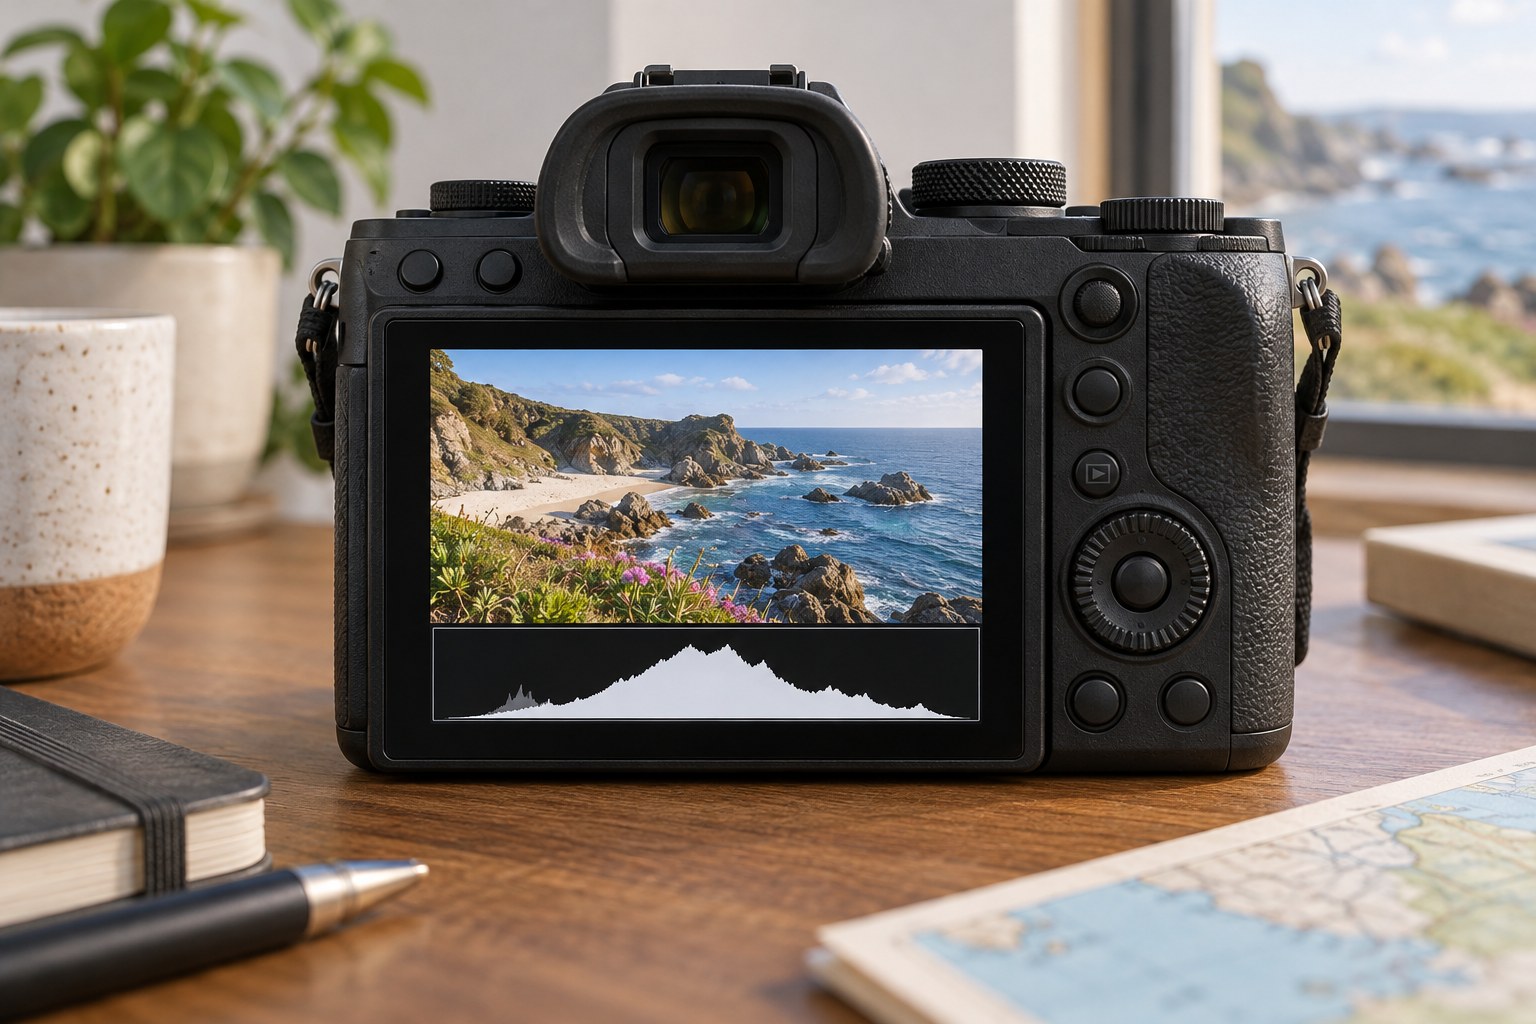
A histogram counts how many image pixels fall at different brightness levels. Dark values appear towards the left and bright values towards the right. It does not tell you where those pixels are in the composition, and it does not know whether the picture contains snow, a black wall or a mixture of both. There is no universal shape that every well-exposed photograph should have.
Start with the subject. A white room may produce a large concentration on the bright side, while a night scene may contain mostly dark values with a few isolated lights. Moving either distribution towards the centre simply to make the graph look balanced can change the intended appearance. Use the graph to investigate a problem you can identify in the image.
Inspect the boundaries and the picture together
A distribution pressed against the right boundary can indicate clipped highlights, but ask which highlights they are. Lost detail in a white wedding sleeve matters differently from a tiny reflection of the sun on chrome. Turn on the highlight warning if available and locate the affected areas. Then decide whether reducing exposure would protect something important or merely make the main subject too dark.
The same reasoning applies to the left boundary. A deep opening beneath a bridge may legitimately be black. A face that has disappeared into that region may need a different exposure or different light. A graph alone cannot distinguish those cases. Zoom into the image and connect the warning with an actual object before changing settings.
Many camera histograms are based on the processed preview rather than a direct measurement of all raw-file editing latitude. Picture style, contrast and white balance can influence the display. Treat it as a useful warning system, not an exact promise about what a raw converter can recover. For colour-critical highlights, inspect separate colour channels if the camera offers them.
A narrow spike reaching the top of the graph is not the same thing as values running into the right boundary. The graph's vertical dimension represents how many pixels share a tone; a large plain wall can create a tall spike simply because much of the picture has similar brightness. Clipping concerns the limits of the horizontal tonal range. Keeping those two directions separate prevents unnecessary exposure corrections.
Try a frame with a small bright lamp in a mostly dark room. The overall histogram may look harmless because the lamp occupies few pixels, yet the lamp itself can be clipped. Locate it in the image rather than expecting a large visible spike. This is also why a histogram cannot replace checking a small important white label or a tiny bright face.
When comparing an exposure sequence, keep the camera's picture settings consistent. A high-contrast preview can make shadows and highlights look more extreme than a gentler preview. The recording may still require a different exposure, but changing preview style and exposure together makes it difficult to know what caused the improvement.
Make a small exposure change and take another frame. Compare both the graph and the important texture. This establishes whether the adjustment solved the problem without creating another one. In stable light, the resulting settings can serve for a sequence, but check again when sunlight, framing or the proportion of bright background changes.
A useful exercise is to photograph a dark cloth and a white sheet under the same light. Preserve the intended tone of each and compare their very different histograms. The pair demonstrates why reading the subject must come before interpreting the graph.